
Building the perfect audio visualization ⚓
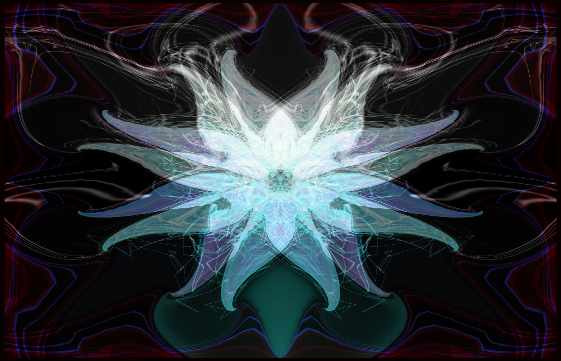
01 May 2017I made this as my animated wallpaper recently (Click to play/pause):
above video has a audio component, click at your own peril.
What follows is the story and the tech behind making this.
The Wallpaper
I have a long history of using custom wallpapers. This was my wallpaper from 2014-:

When I asked Vikalp to design a new one, I knew I wanted something that was slightly more softer. This is what he came up with, after a few iterations:

This wasn’t the final iteration, and both of us agreed that there was something missing.
Visualizations
I saw a colleague using cava and spent a bit of time trying out different
visualization software. The ones that I tried out:
- cava
- works perfectly with i3, runs on a terminal. I couldn’t get it to work cleanly with transparency.
- mildrop
- Winamp’s legacy. This works great for parties, but is not really an everyday-use visualizer.
- spectrumyzer
- Worked with transparency, but limited to bars visualization.
I decided to go ahead with Spectrumyzer (This is the default config):

The Traffic Jam
The very same day, stuck in a traffic jam1, I asked Vikalp for some color ideas on the visualization.
The obvious 2 were tried first:


It finally dawned on us to use the light blue variant with padding set to zero:

Here is one showing the actual positioning (set using the offsets):

Bezier Curves
With the padding set to zero, it already looked great. I ended up using this as my wallpaper for the next one week. Vikalp wanted to make the bars non-rectangular, and I spent some time figuring out how to make waveforms using bezier curves2. The basic learning from my experiments were:
- Cairo has methods for drawing cubic bezier curves.
- Cubic bezier curves have 2 control points.
- The control points must be symmetric (equidistant) as well as parallel to the origin points.
- The parallel part ensures that the ending and starting line segments are always tangential giving a smooth joining.
This is roughly what you want to do when drawing waveforms:
If you are interested in playing around with Bezier curves, see Animated Bézier Curves. A Primer on Bézier Curves is a math-heavy explanation if you want to read further3.
The code I wrote picks the midpoints of the bars and then connects them using bezier curves:
# control point cords
# Make sure these are symmetric
c1x = rect_top_mid_x + 16
c2x = next_rect_top_mid_x - 16
c1y = rect_top_mid_y
c2y = next_rect_top_mid_y
I also had to make the number of bars configurable (this is default=64, which doesn’t look great):

Here is the complete final result in HD:
What I learned
- Bezier curves are not magic.
- Drawing pixels on screen and filling them was quite easy with Cairo and Python.
- Coding is wizardry. The things that I take for granted every day (take a multi-page website and get useful tabular data out of it, for eg) are unthinkable for most people. The idea of doing water waves was something I knew would be possible before I even looked at the codebase.
If you’d like to replicate this setup, or build upon it, here is my spectrum.conf file. I also filed a PR (now merged!) to the spectrumyzer project adding support for curve based renders.
-
Sony World Junction - Where startup ideas are born. ↩
-
The Spectrumyzer codebase turned out to be fairly easy to understand. It was just cairo and pyGTK. ↩
-
A Primer on Bézier Curves was published on HN just a few days after I finished this project. ↩
Published on May 01, 2017